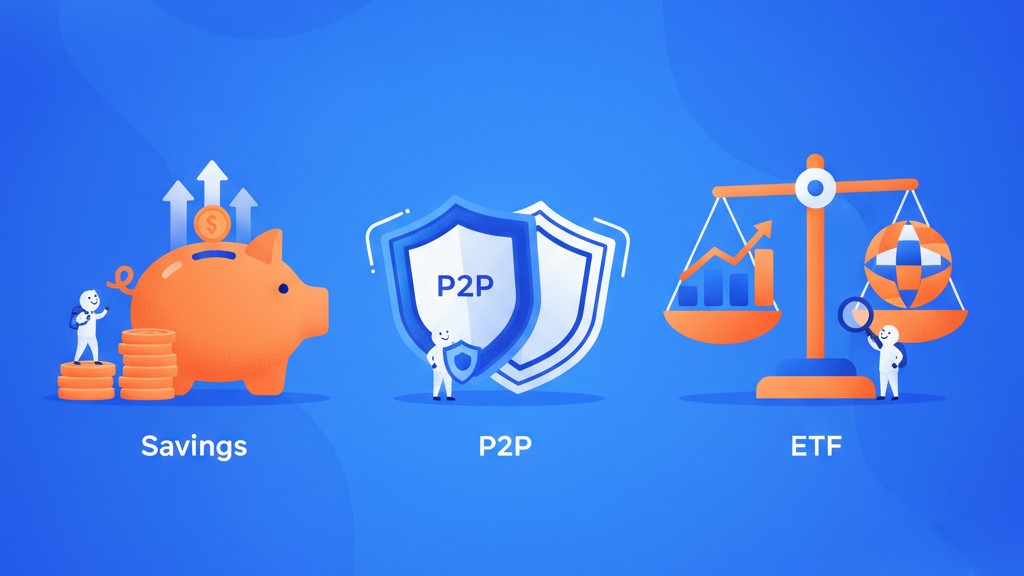
In 30 seconds
- 9-15% vs 7% vs 2.5%: P2P advertises the highest yield, but borrower defaults and platform risk eat into that premium.
- Protection: savings accounts carry state deposit insurance up to EUR 100,000; ETFs ring-fence assets in custody; P2P has no compensation for borrower defaults.
- Liquidity: ETFs trade instantly; savings withdraw same-day; P2P imposes lock-ups or illiquid secondary markets.
- Effort: savings and ETFs are set-and-forget; P2P demands platform research, diversification and monthly monitoring.
- Blended approach: many investors hold 60% equity ETF, 30% P2P, 10% cash to capture yield and growth while limiting concentration.
The three vehicles at a glance
Every euro you invest sits in one of three buckets: contractual lending, equity ownership or insured deposits. Each carries a distinct risk-return profile, liquidity constraint and effort burden.
| Attribute | P2P Lending | Equity ETF | Savings Account |
|---|---|---|---|
| Advertised return | 9-15% per year | ~7% long-term | 2.0-3.0% per year |
| Return type | Contractual interest minus defaults | Capital gains + dividends | Fixed interest |
| Principal risk | Borrower default + platform failure | Market drawdown | Bank failure above EUR 100k |
| Protection | None for defaults; ECSP/MiFID conduct rules | CSD custody segregation | State deposit insurance up to EUR 100k |
| Liquidity | Lock-ups or illiquid secondary market | Instant (T+2 settlement) | Same-day withdrawal |
| Tax treatment | Annual income tax on interest | Deferred CGT on sale; dividend tax | Annual income tax on interest |
| Effort | Platform research, diversification, monitoring | One purchase, annual rebalancing | Set and forget |
| Best for | Income seekers who accept illiquidity | Long-term growth with liquidity | Emergency reserves, short goals |
Return: the P2P premium is payment for risk
P2P platforms advertise yields between 9% and 15% for 2026, with Maclear at 14.5-14.9% and Mintos at 9-11%. Equity ETFs tracking the MSCI Europe or S&P 500 have delivered around 7% annualised over rolling ten-year periods. High-yield savings accounts in the eurozone pay 2.0-3.0% as of early 2026.
That seven-to-thirteen-point spread is not free money. It compensates for three costs that savings and ETFs do not carry:
- Borrower defaults: consumer loans default at 3-8%; SME loans at 5-12%; property bridge loans can lose 30-60% in distressed cycles. Your advertised 14% shrinks to 10% after a 4-point default drag.
- Platform failure: EstateGuru and Reinvest24 froze withdrawals in 2024; investors face years in recovery queues. A platform collapse can erase entire allocations.
- Illiquidity: you cannot exit at will. Lock-ups, secondary-market discounts and withdrawal queues mean your capital is stuck when you need it. ETFs and savings accounts let you liquidate same-day.
If you are unwilling to accept those three risks, the P2P premium is not worth it. The extra yield exists precisely because rational investors demand compensation for bearing risk that savings and ETFs do not carry.
Protection: only savings accounts cover principal
State deposit insurance schemes across the EU guarantee savings-account balances up to EUR 100,000 per depositor per bank. If your bank fails, the national authority reimburses you within seven working days. Equity ETFs use central securities depositories that segregate your shares from the fund provider's balance sheet; if the ETF issuer collapses, you still own the underlying equities.
P2P platforms offer no compensation for borrower defaults. An ECSP licence or MiFID authorisation imposes conduct rules and capital requirements on the platform itself, but does not insure your loan portfolio. Mintos operates a EUR 20,000 compensation scheme for certain operational failures - lost client money, misappropriation - but that scheme explicitly excludes borrower defaults. If a consumer in Croatia stops paying, your loss is yours.
The only partial exception is a buyback guarantee, where the loan originator promises to repurchase non-performing loans. Robocash and PeerBerry have honoured buybacks for years, but a buyback is only as good as the originator's solvency. When the music stops, the guarantee evaporates.
Liquidity: instant vs same-day vs locked
Liquidity determines whether you can access your capital when life surprises you - a car breaks down, a roof leaks, a job ends.
Savings accounts and money-market funds let you withdraw same-day, no questions asked. Equity ETFs trade on exchanges with T+2 settlement; you sell Monday, cash lands Wednesday. Even in a market crash, you can liquidate at the prevailing price.
P2P platforms impose friction. Some loans lock your capital for six months or two years with no early exit. Platforms with secondary markets - Mintos, PeerBerry - let you list loans for sale, but buyers demand discounts during stress, and illiquid markets can force you to sell at 90 cents on the euro. EstateGuru and Reinvest24 froze withdrawals entirely in 2024, leaving investors in multi-year workout queues.
The lesson: never invest money in P2P that you might need within 12 months. Emergency reserves belong in savings accounts, even if the yield lags inflation.
Effort: set-and-forget vs active management
A broad-market equity ETF and a high-yield savings account are fire-and-forget vehicles. You buy once, rebalance annually, and ignore the rest. Tax reporting is automatic through your broker or bank.
P2P demands continuous work:
- Platform research: read grades, check licences, verify ownership structures, review default queues. Budget two hours per platform before your first deposit.
- Diversification: spread across five to ten platforms to contain single-platform risk. That means five KYC processes, five tax reports, five logins to monitor.
- Monthly monitoring: track realised returns, spot rising defaults, watch for regulator alerts or ownership changes. If a platform deteriorates from grade B to C, you need to act.
- Tax reporting: every loan repayment is taxable interest. Platforms provide annual statements, but you must reconcile them with your national tax return. Some jurisdictions require monthly reporting for gains above a threshold.
Auto-invest tools reduce the mechanical workload, but they do not eliminate concentration risk or the need to audit your portfolio quarterly. Budget two hours per quarter if you hold five platforms; four hours if you hold ten.
Tax friction: deferred vs annual
Equity ETFs defer capital-gains tax until you sell. You can hold a position for twenty years, reinvest dividends, and pay tax only when you liquidate. Accumulating ETFs compound dividends within the fund structure, further deferring the tax event. In many EU jurisdictions, long-term capital gains face lower rates than ordinary income.
P2P interest is taxed annually as income, at rates up to 50% in Belgium, France and Sweden. A 14% advertised yield becomes 7% after-tax for a high earner. Savings interest faces the same treatment, so P2P and savings are tax-equivalent in most cases.
Ireland-domiciled ETFs benefit from treaty networks that reduce withholding tax on US dividends from 30% to 15%. If you hold a US equity ETF through an Irish wrapper, you capture an extra 15 basis points of yield compared to a direct US fund. P2P has no such treaty advantage.
When each vehicle wins
Savings accounts win for emergency reserves
Three to six months of expenses must sit in instant-access cash. A 2.5% yield beats zero, and deposit insurance covers you if your bank fails. P2P and ETFs are wrong here because you cannot afford illiquidity or drawdown risk when the boiler breaks.
Equity ETFs win for long-term growth
If your time horizon exceeds ten years and you can tolerate 30-40% drawdowns, equity ETFs deliver the highest expected return with daily liquidity. Tax deferral and treaty benefits add another 50-100 basis points over P2P. Allocate retirement savings and children's education funds here.
P2P wins for income seekers who accept illiquidity
If you need monthly cash flow, can lock capital for 12-24 months, and are willing to research platforms and monitor defaults, P2P delivers the highest contractual yield. Maclear at 14.9% and Indemo at 21-22% realised beat any savings account or bond ETF. The trade-off: you bear default and platform risk with no compensation scheme.
Blended portfolio examples
Most investors do not pick one vehicle. They blend all three to capture yield, growth and liquidity.
| Investor profile | Savings | ETF | P2P | Logic |
|---|---|---|---|---|
| Conservative, six-month horizon | 80% | 20% | 0% | Liquidity paramount; P2P lock-ups unacceptable. |
| Moderate, five-year horizon | 10% | 60% | 30% | ETF growth + P2P income; savings cover short needs. |
| Aggressive, ten-year horizon | 5% | 70% | 25% | Maximise equity upside; P2P satellite for yield. |
| Income-focused retiree | 20% | 30% | 50% | Contractual cash flow from P2P; ETF dividend; cash buffer. |
These splits are illustrative, not advice. Your allocation depends on income needs, risk tolerance and liquidity constraints. The principle holds: no single vehicle optimises everything. A blend captures the strengths of each while containing the weaknesses.
The honest line
The P2P premium is not a free lunch. It is payment for bearing default risk, platform risk and illiquidity that savings accounts and ETFs do not carry. If you understand those risks and can afford to lock capital for 12-24 months, P2P delivers the highest contractual yield in Europe today. If you need liquidity or cannot stomach platform failure, stick with ETFs and savings.
No compensation scheme covers borrower defaults. A platform licence protects the platform, not your loan portfolio. Advertised yields shrink after defaults. These are not edge cases - they are the base case for P2P investing.
Use our earnings calculator to model blended allocations and see how the numbers play out over one, three and five years. Compare platforms on the grade list and read risks and safety before you invest your first euro.
No. Emergency reserves need instant liquidity and zero capital risk. A savings account or money-market fund delivers both; P2P platforms impose lock-ups or secondary-market friction, and borrower defaults can eat into principal. Keep three to six months of expenses in a savings account, even if the rate lags inflation, then allocate surplus capital to higher-yield vehicles.
P2P and equity ETFs serve different roles. ETFs offer growth potential with deep liquidity; P2P delivers contractual income with platform and default risk. A blended approach - for example 60% equity ETF, 30% P2P, 10% cash - captures both upside and yield while containing concentration. P2P should rarely exceed 30% of invested capital.
It depends on residency. ETFs domiciled in Ireland or Luxembourg benefit from treaty networks and deferred capital-gains tax; you only pay when you sell. P2P interest is taxed annually as income in most EU states, at rates up to 50%. Savings interest also faces annual income tax. ETFs typically win on tax efficiency for long holds; P2P and savings are taxed identically in many jurisdictions.
Savings accounts and broad-market ETFs are set-and-forget: one purchase, annual rebalancing at most. P2P demands platform research, diversification across five to ten platforms, monthly monitoring of default queues, and tax reporting for every loan repayment. Auto-invest tools reduce the workload, but you still carry concentration risk if a single platform fails. Budget two hours per quarter for P2P portfolio management.
The extra yield - typically 7 to 13 percentage points above a savings account - compensates for three risks: borrower defaults that erode principal, platform failure that locks or loses your capital, and illiquidity during market stress. If you are unwilling to accept those risks, the premium is not worth it. The premium is not free money; it is payment for bearing risk that savings and ETFs do not carry.
Keep reading
Earnings Calculator
Model blended allocations across P2P, ETF and savings to see how returns compound over one, three and five years.
Risks & Safety
The five risks every P2P investor faces - default, platform failure, liquidity, currency and regulatory - and how to contain each one.
The 2026 Grade List
Every European P2P lending platform graded A+ to D on protection, delivery and structure. Updated monthly.